Mass Spectrometry

In Brief: Services
- Discussion about the project and experimental design
- Sample preparation
- Fractionation
- Chemical peptide labeling
- Enrichment of post-translational modifications (PTMs)
- Quantitative protein profiling using the state-of-the-art mass spectrometry instrumentation
- Spectrum identification
- Downstream bioinformatical/statistical analysis
- Result reporting, including plots, tables and hints for interpretation
- Data back-up
If you are interested in proteomic analyzes, please do no hesitate to contact us for an initial discussion.
Introduction to Mass Spectrometry
Mass spectrometry (MS) is a technology that, as hinted at by the name, measures masses of ionized compounds (more about ionization further down) in a spectrometric manner. The latter implies this to happen in parallel for a whole mass range or spectrum. What follows briefly introduces MS-based proteomics and its value to the biomedical research endeavor.
An exemplary MS instrument looks as follows:
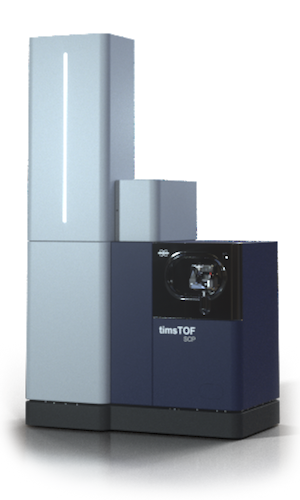
This particular machine is rather big (approx. 1x1.5x2.5 m WLH), but smaller ones fitting your desk exist1. Given the equipment’s substantial cost and its sensitive nature, mass spectrometers are commonly maintained and run by facilities like the Core Facility Translational Proteomics, with the aim to optimize their handling and render them widely accessible.
1 More about this in the section about Common instrument types 3.2.1
- Our goal
-
Protein identification and relative abundance change of proteins between experimental conditions are at the core of most projects proteomic analysis is applicable to.2 In other words, in a proteomic measurement, we aim to get as much information about the proteinaceous content of the sample as possible, including comparing the abundance of measured proteins between different samples/conditions. In parallel instrumentation must protected, avoiding overloading and potential damage to the mass spectrometer or the liquid chromatography setup attached to it for sample injection and separation. It is thus imperative to provide all details of sample preparation including the exact composition of buffers used when submitting samples for analysis. Detergents and salts in particular can wreak instrumental havoc — their effects can be counteracted, but prior knowledge of their presence is essential.
2 For more details, see Data acquisition 3.2.
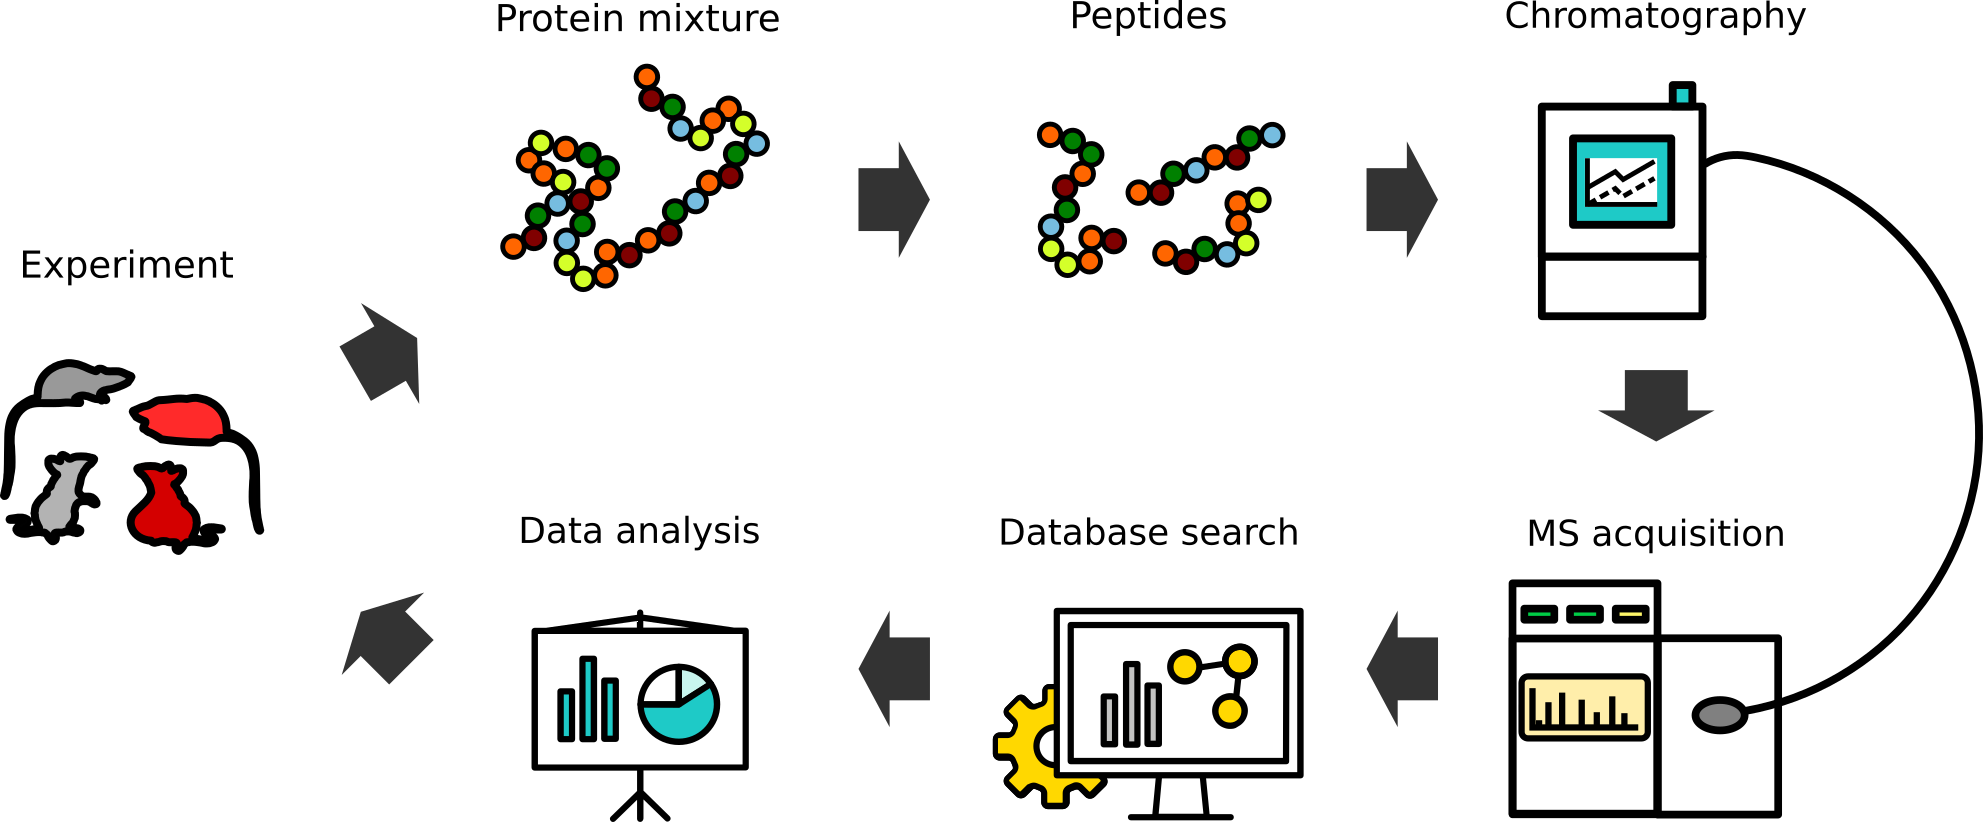
The Archetypal Proteomic Workflow
In a typical experiment (exemplarized in Figure 3), a researcher provides a biological sample. All manner of samples ranging from cell pellets, cell lysates, or secretomes (tissue culture supernatant), to sorted cells, eluates from immunoprecipitation experiments, SDS-gels, and many more may be analyzed. After a potential sample type-specific protein extraction step, proteins in the (possibly very complex) mixture are converted into short peptides — commonly using trypsin. The resulting, even more complex peptide mixture, is in a next step separated/fractionated on an analytical liquid chromatography column and directly injected into an MS-instrument, where the actual measurement occurs. Following data acquisition, raw data are being processed by software interpreting it based on a protein database provided. The algorithm, in essence, attempts to match the measured signals to theoretical ones derived from the database, as well as to relatively quantify the signal. The processing yields a list of proteins identified through peptides and a quantitation measure, which may be fed to further biostatistical downstream analyzes.
Each of the steps outlined above is subject to adaptation, optimization, extensions and modifications (shown on Figure 4). From these options and in conversation with the sample-providing researcher, the standard workflow can be adapted to optimally match both sample type and the biomedical question underlying the experiment.
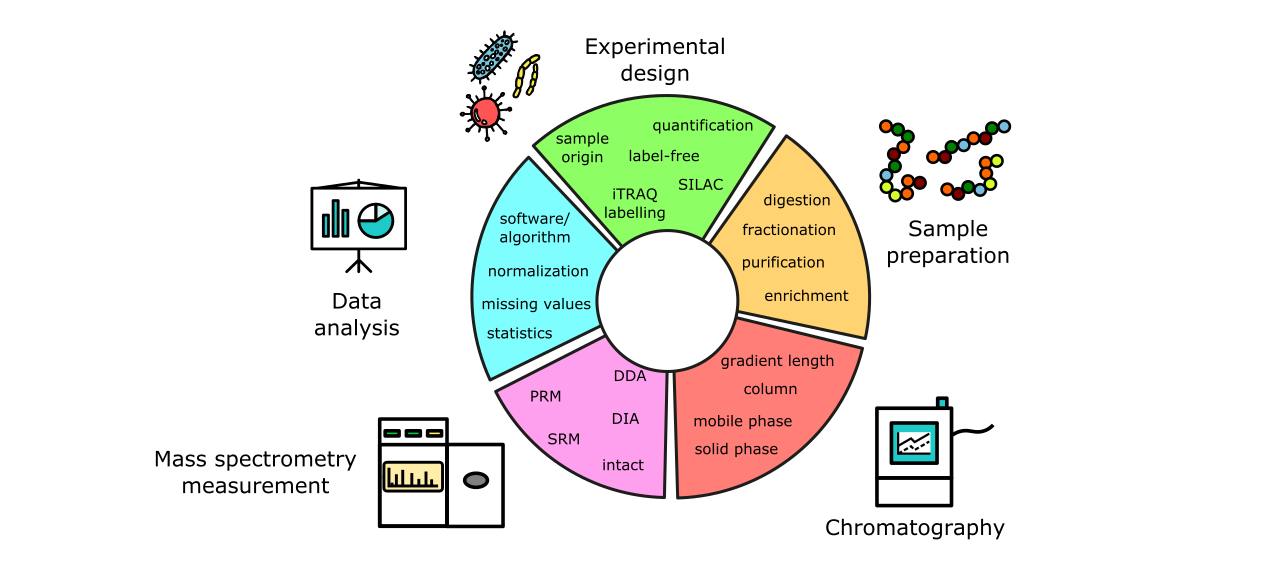
A non-exhaustive list of possible protocol modifications includes:
- Choice of quantitation protocol to suit the organism at hand, quantitation precision required etc.3
- Adjusted peptide generation/digestion strategy (to e.g. generate peptides spanning a particular site of interest in a protein)
- Inclusion of a prefractionation step on both the protein or peptide level for increased proteome coverage
- Selective enrichment of post-translational modifications (PTMs) to study them
- Variation of gradient lengths for the in-line liquid chromatography to optimize instrument usage and acquisition depth
- Adaptations to the mass spectrometer’s mode of acquisition
3 Head over to your friendly search engine of choice and explore the terms TMT, iTRAQ or SILAC labeling, for more information.
But fear not: The Core Facility Translational Proteomics is here to choose what’s right for your experiment.
Sample preparation

In order to prepare samples for mass spectrometry measurements, proteins mast be converted into peptides and freed from other contamination like detergents, salts, nucleic acids etc.
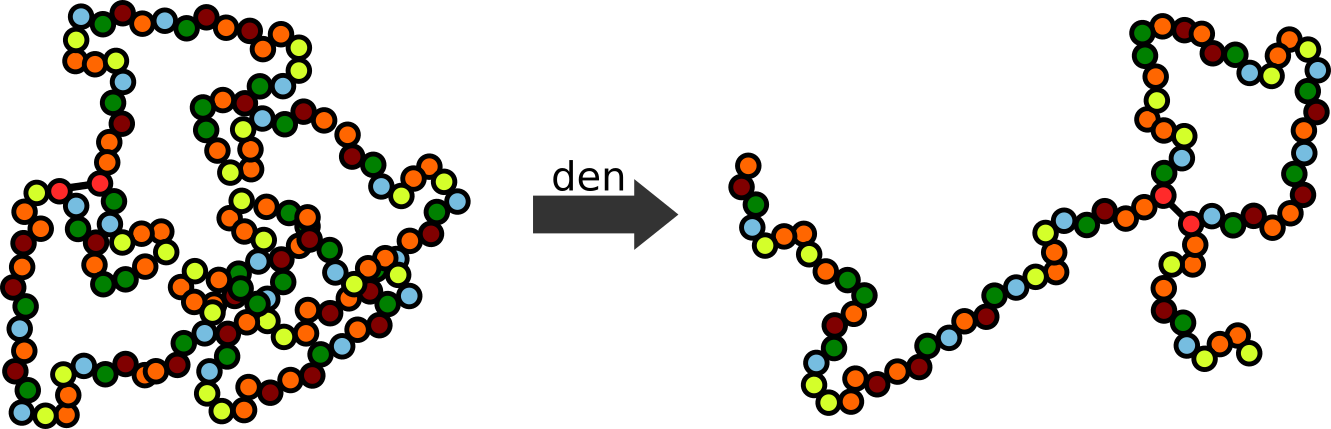
Step 1: Denaturation
Protein denaturation employs external stress to (chemical or temperature) to dissolve non-covalent protein structure and protein interactions present natively. Peptide bonds are, however maintained and proteins thus retain their primary structure (Figure 6).
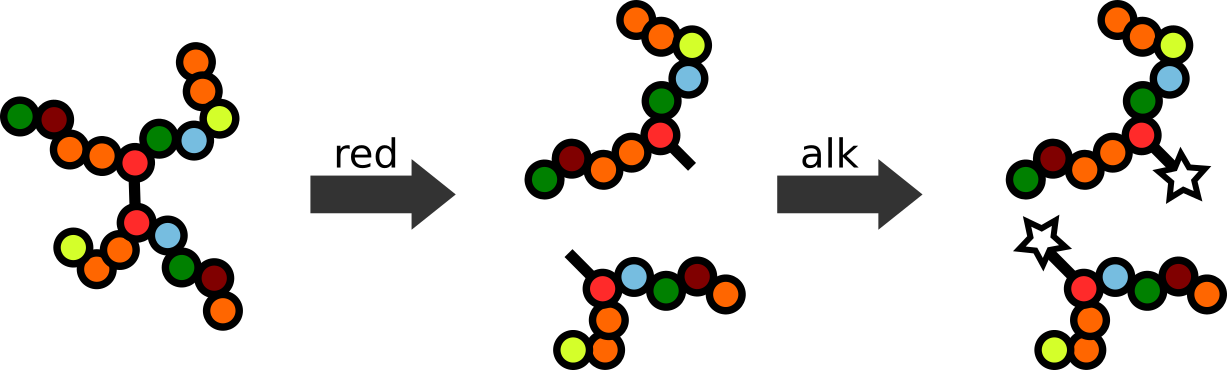
Step 2: Reduction and Alkylation
Next, a protein sample typically is reduced & alkylated to break disulfide bridges and modify resulting reduced cysteines to prevent re-oxidation. Strong reducing agent, such as DTT (dithiothreitol) or TCEP (tris(2-carboxyethyl)phosphine) are used to to break disulfide bonds, followed by alkylation, typically using iodoacetamid (IAA)), to block recreation of disulfide bonds.4
4 For more information, take a look for example here.
In the absence of this procedure peptides derived from regions containing disulfide bonds result in mixed spectra, representing non-consecutive protein sequences. Such chimeric spectra are difficult to identify during database search5 and the archetypal workflow thus aims to avoid them.
5 More about this topic in section Spectra identification 3.4
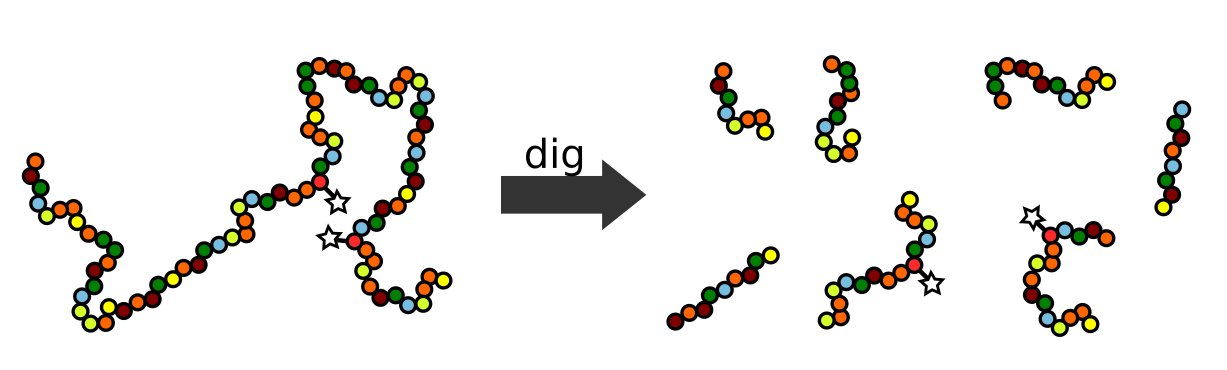
Step 3: Digestion
Much of MS-based proteomics does not analyze proteins at all!6 Instead, proteins to be analyzed are enzymatically digested/cleaved into short peptides. Protein digestion is performed by an enzyme referred to as endopeptidase or endoproteinase. These enzymes break peptide bonds of non-terminal amino acids (within the molecule). Trypsin is the enzyme most commonly used in mass spectrometry-based proteomics and breaks peptide bonds c-terminally of Arginine (Arg, R) or Lysine (Lys, K).
6 Measuring intact or whole proteins is possible, but tricky, and requires clean, uniform samples (not complex mixtures like cell lysates etc.). Such “top down” proteomics approaches are e.g. useful in pharmacology, for studying interactions between individual proteins and other chemical compounds.
Step 4: Desalting
Sample cleanup and desalting is an important step in mass spectrometry, as it removes excess salt and other contaminants from a sample, improving the quality and accuracy of the data. Examples for problematic impurities include salt ions, which may form non-covalent adducts to peptides, which alter the apparent mass of the peptide (by the mass of the salt ion), rendering its mass-based identification difficult. Salt also interferes with peptide ionization, a process central to rendering peptides analyzable using mass spectrometry. Detergents, as another example, strongly interfere with liquid chromatography used to separate peptides en route to the mass spectrometer. Over time, excess salt and other contaminants also reduce sensitivity as well as accuracy of mass spectrometers and result in time consuming instrument maintenance.
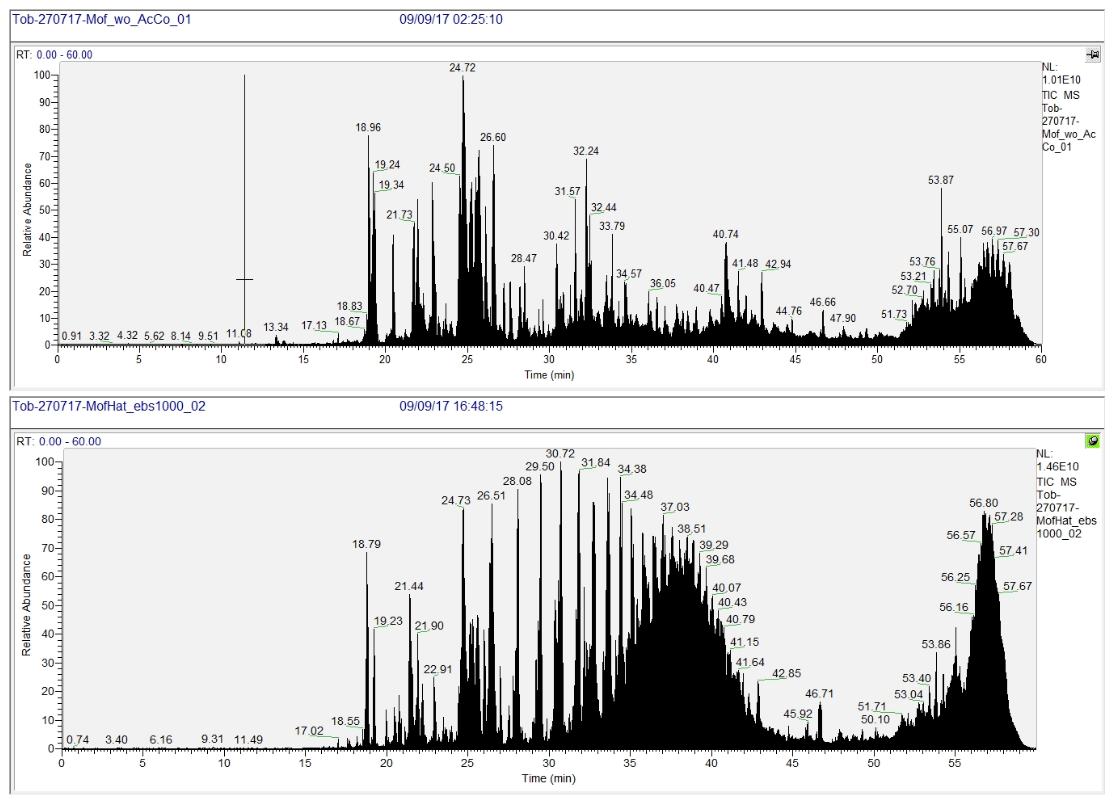
Figure 9 shows examples for chromatograms of successful (top) and unsuccessful (bottom) sample preparation as read out by mass spectrometry. In this case, a detergent contaminated the lower sample. A characteristic envelope of repetitive peaks eluting from the analytical column is observed. Aside from the detrimental effects mentioned above, even with the naked eye it may be perceived, that the intense detergent signals mask others that derive from peptide ions.
Optional: PTM Enrichment
Post translational modifications of proteins are central to many biological processes, as they regulate the activity of proteins and affect their structure, function as well as influence their interaction with other molecules. Prominent example modifications are phosphorylation, acetylation and ubiquitination, but many, many more exist. Modifications frequently arise in the cell for brief periods of time and in a substoichiometric amounts only. PTM-mediated biological function may accordingly be performed by a small fraction of the total number of molecules present of a protein, rendering the modified form in danger of being lost below the limit of detection (see Section MS measurement 3.2). This effect is commonly counteracted through enrichment protocols specific for peptides carrying specific PTMs.
Optional: Fractionation
Peptide fractionation prior to mass spectrometry (MS) measurement may be used to improve the sensitivity and accuracy of the measurement. Peptides in a complex sample are fractionated into different groups (fractions), based on their physico-chemical properties (for example size or hydrophobicity). This reduces the complexity of the sample in MS analysis, which benefits analytical quality and depth. This benefit comes, however, at the cost of labor-intensiveness, a common need for specialized equipment or commercial kits, as well as multiplies the amount of samples that need to be measured, all of which result increased cost.
MS Measurement
Desalted peptides are finally dissolved in a low pH solution and represent the primary analyte. During analysis they give rise to ions (low pH → many protons (H⁺) → protonated, positively charged peptides), which are aspirated into the MS instrument due to a very low internal pressure environment (ultra-vacuum) — akin to how a vacuum cleaner works, albeit an expensive one of very low efficiency. After a peptide ion is thus introduced into the mass spectrometer, the instrument guides and manipulates it using electrodes generating electromagnetic fields. The ion’s charge is essential to making that possible. At the end of a trip through the instrument guided by vacuum and electric potentials, peptide ions meets a detector, which determines their mass to charge (m/z) ratio.
Common Instrument Types
Currently two types of mass detectors dominate the field of MS-based proteomics: Orbitraps and Time of Flight (TOF) instruments.
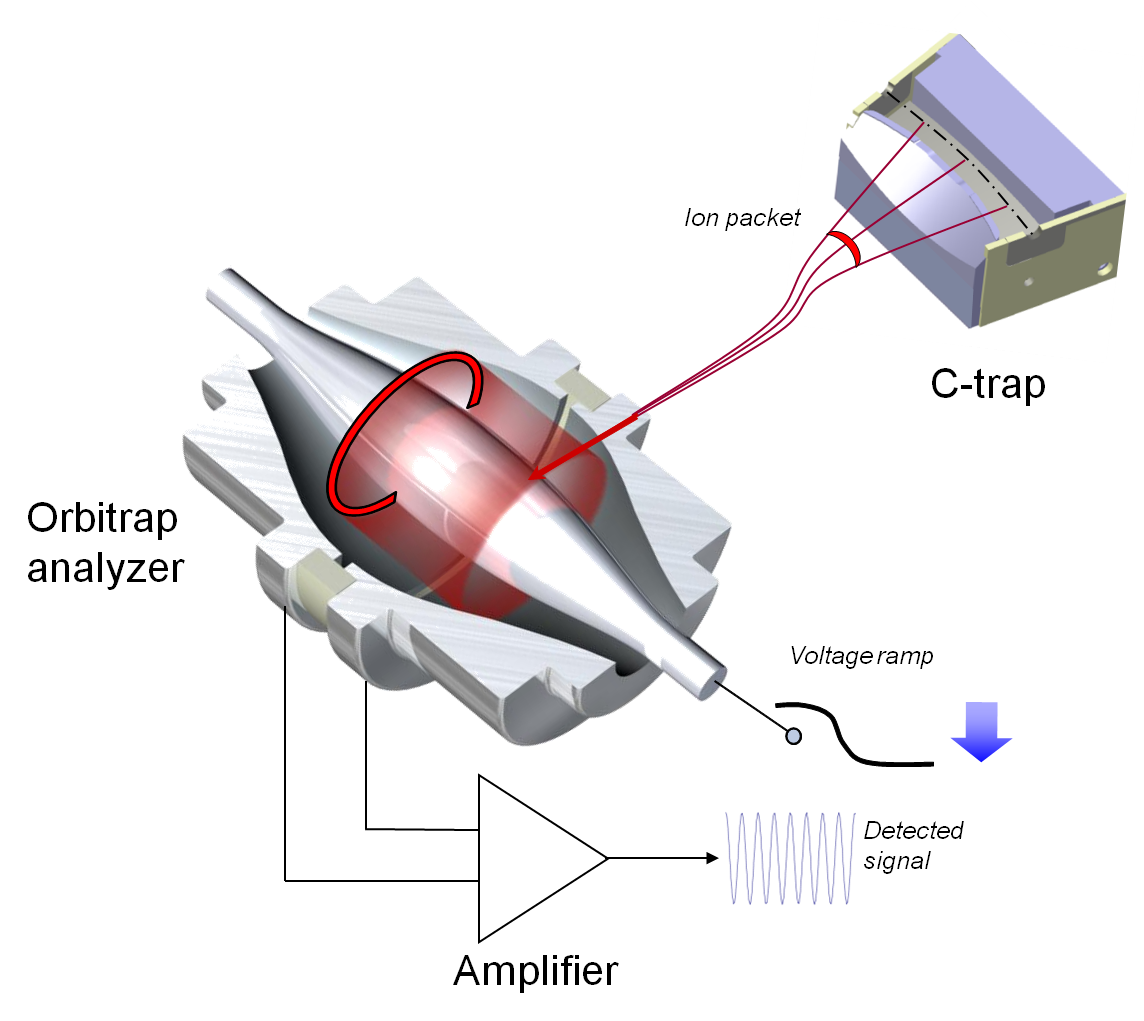
- Orbitrap Instruments
-
measure m/z by reading the oscillation frequency of ions along a spindle-like electrode (see Figure 10). Heavier ions oscillate with slower speed than lighter ones, and resulting signals are measured and teased apart using complex signal processing.
- TOF Instruments
-
use a more intuitively approachable way to measure mass of the ion. Their, in comparison with e.g. Orbitrap instruments, larger dimensions is mostly due to a flight tube — a veritable racetrack for ions. At the entry point to the tube all ions are accelerated towards the detector with identical force, leading lighter ions to travel at higher speed than heavier ones, thus yielding different arrival times at a terminal detector. Mass measurements in this case are read from flight time differences between the accelerating “push” and detection. Figure 11 depicts the exemplary ion guiding components of the TOF-MS shown in Figure 2 — notably without the flight tube which would dwarf all other components and is located adjacent to the Accelerator component to the left.

Tandem mass spectrometry, MS/MS, MS²
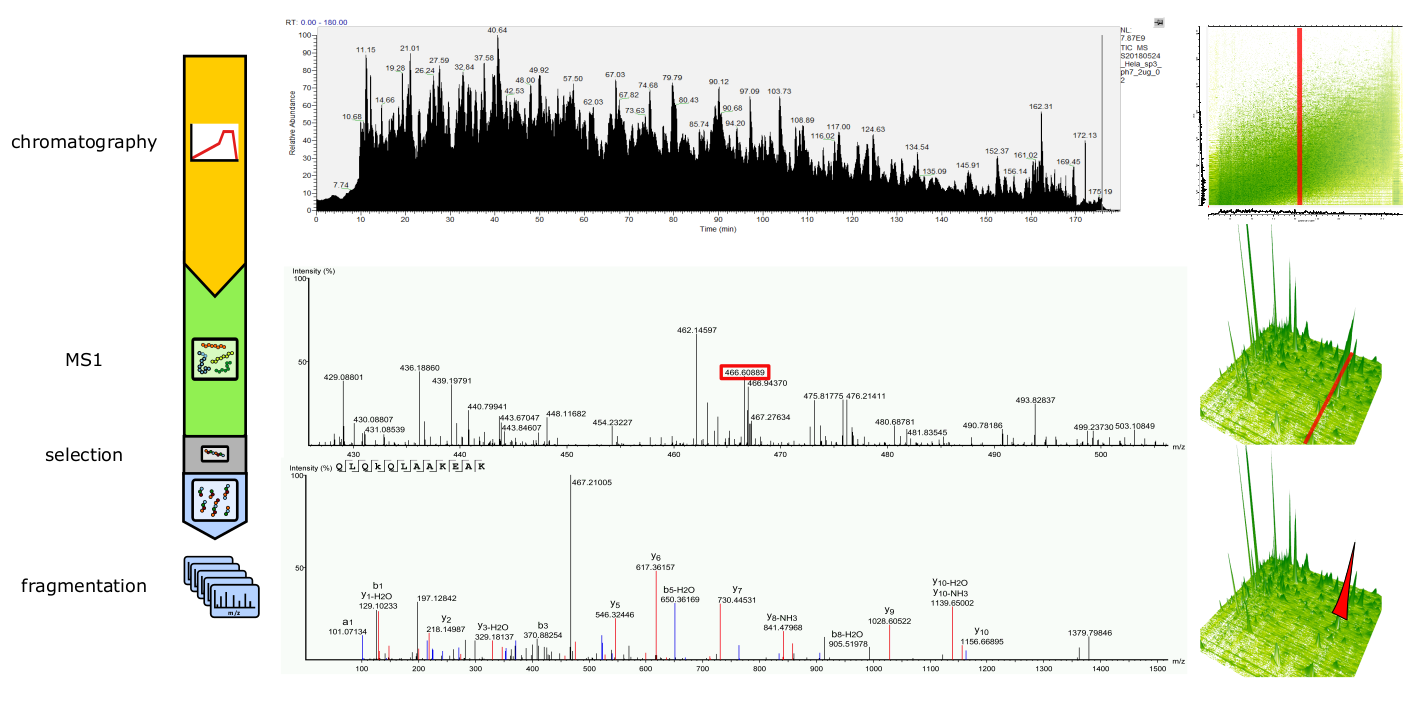
The most prominent type of mass spectrometry used is commonly referred to as tandem mass spectrometry, because to analyze and characterize a particular peptide ion, a combination of two measurements are employed. MS1, “precursor ion-”, or “full scan/spectrum”, measures the mass of an intact ion (Figure 12, middle panel), also referred to as a parent ion. This information is however not sufficient, to identify a particular peptide sequence with high confidence 7. Therefore a second scan/spectrum, MS2 or “fragment ion spectrum” is performed (Figure 12, bottom panel). Here, an individual ions from the MS1 scan is selected, ion fragmentation is performed and their spectrum acquired, yielding peptide sequence information.
7 Imagine the same combination of amino acids, just put together in a differing order. They will all have the same m/z, but their sequences differ.
Common types of ion fragmentation include:
Collision-induced dissociation (CID): peptide fragmentation by collision with an inert gas, such as argon or nitrogen.
Electron capture dissociation (ECD): peptides are fragmented by capturing one or more internal electrons, causing them to become highly charged and unstable, resulting in fragmentation.
Electron transfer dissociation (ETD): ions are fragmented by transferring electrons between the ions and an external, additionally injected reagent, such as a radical species or a buffer gas. The fragmentation mechanism is ultimately identical to that in ECD.
Higher energy collision dissociation (HCD): HCD is similar to CID, but uses higher energy collisions to fragment the ions.
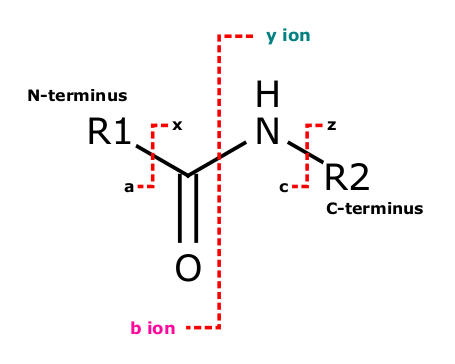
All these techniques rely on the fact, that the peptide bond, which is the bond between the amino acid residues in the polypeptide chain, is relatively weak and may easily be broken in a semi controllable way. In HCD, which is the fragmentation method the Core Facility Translational Proteomics prefers, the majority of fragments consist of b and y ions (see Figure 13).
How does the MS instrument decide, which parent ions should be selected for MS2 scans? Three major selection approaches exist:
- DDA - Data dependent acquisition
-
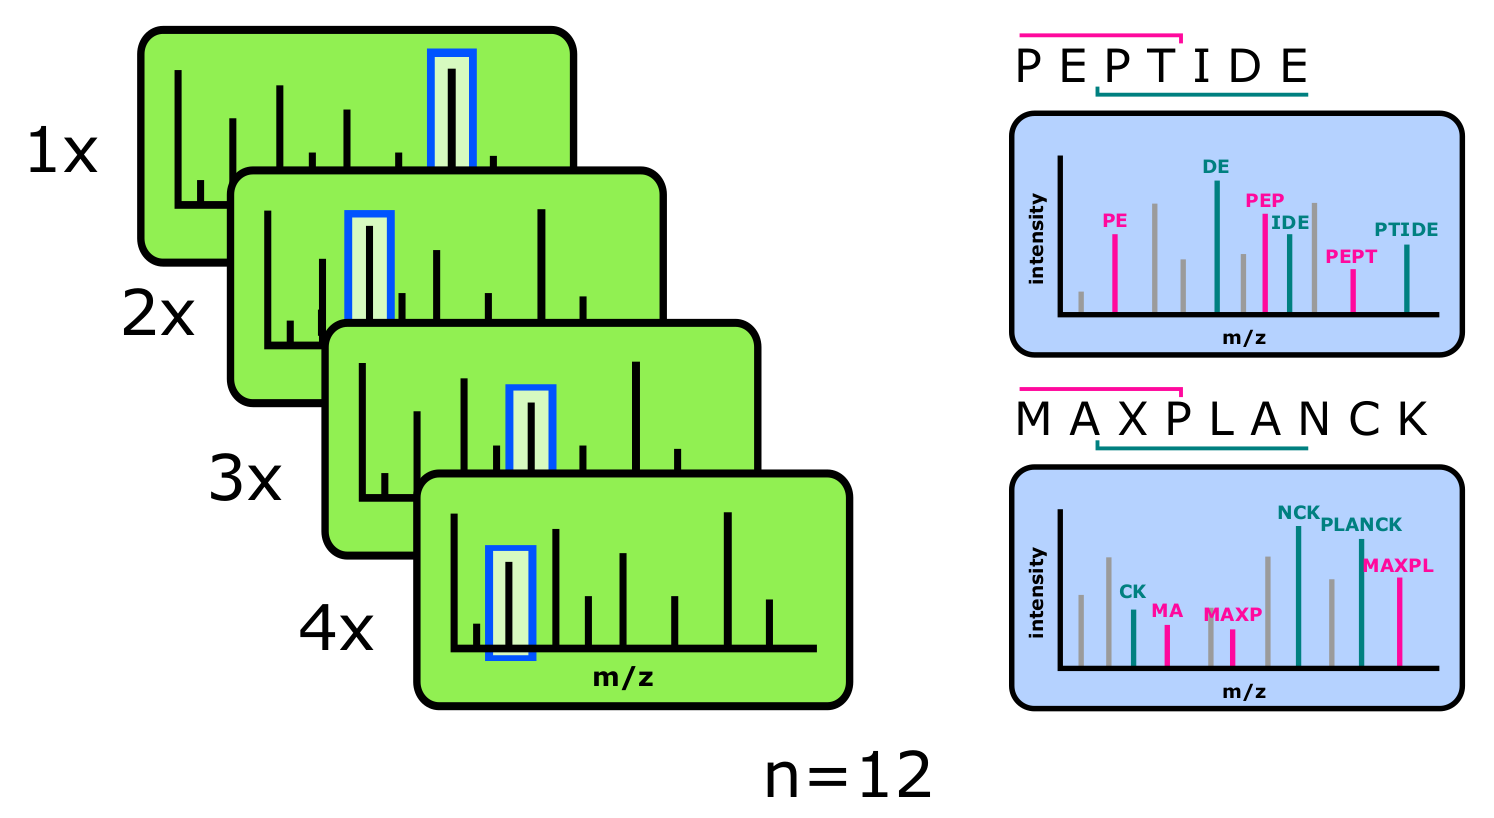
Data dependent acquisition (DDA): the instrument performs a survey scan (full scan), in which a broad spectrum of the sample is acquired. This data is internally used to identify the most interesting and significant ions (commonly the most abundant ones), which are then selected for MS2. Within a particular time frame, the instrument performs between 10 to 25 MS2 scans for every MS1 scan. The advantage of this method is, that a clear connection exists between parent and fragment ions, rendering algorithmic sequence identification comparably simple. In the context of hundreds or thousands of ions eluting in parallel from the analytical column into the mass spectrometer at the same time, the approach implies the draw back that not all precursor ions can be selected and fragmented in time.
- DIA - Data independent acquisition
-
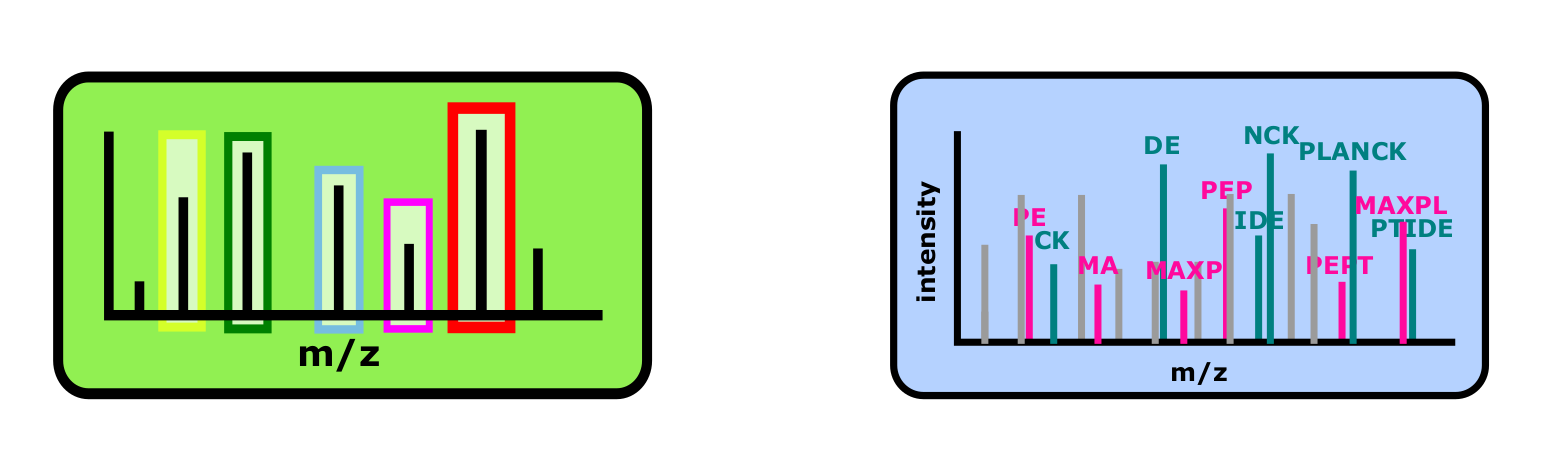
Data independent acquisition (DIA) is a mode of operation in which the instrument acquires MS2 spectra of all ions in a sample, regardless of their relative abundance or significance. In DIA, the instrument does not rely on information from earlier scans to select ions for further analysis, resulting in a more comprehensive and unbiased dataset. While the approach provides deeper data sets with less missing values, datasets are commonly large as well as challenging to analyze and interpret. Specialized software and algorithms are required, and it can be hard to present direct connection between MS1 and MS2.
- Targeted proteomics
-
here, we tell the instrument, which parent ion should be looked for and chosen for fragmentation. This technique increases the sensitivity and accuracy of the measurement for the list of selected ions. It also comes with a possibility for absolute quantification of target proteins, if some specific labeled peptides are used as a reference signal. Targeted approaches come unfortunately with some major setback:
In order to increase aforementioned sensitivity, MS instrument needs to have more time to accumulate more ions of the given type. This means that proteins that are not targeted will not be detected and analyzed and we would loose a lot of information about the sample.
Targeted proteomics approaches can be time-consuming, as they often require a long method development, where we try to find optimal set of peptides for a given protein and adjust all the instrument settings, so that the measurements are reproducible across many samples. Also data analysis is in many cases much more “human involved” and takes more time.
Because of the method development and a need to obtain a heavy labeled peptides for reference, this type of analysis can be expensive.
Quantification
In a majority of quantitative MS approaches, quantification is relative. Measurements accordingly represent the relative concentration of a particular analyte in a sample as compared to a reference sample, standard, or between conditions. In simple words, if a sample contains double the amount of peptides compared to other sample, a higher signal is expected if constant sample amounts are injected into a MS instrument. It is thus important to carefully control the peptide concentration in samples analyzed8.
8 To this end, protein concentration in the standard protocol is measured early using Bradford or BCA and peptide concentration is later determined once more using a fluorimetric assay.
Limit of detection (LOD) and limit of quantification (LOQ) are central concepts in the context of quantitative mass spectrometric analysis. LOD represents the lowest concentration of a substance that may reliably be detected but not necessarily quantified. LOQ is the lowest concentration of a substance that may be accurately and precisely quantified within specified limits. The LOQ is typically higher than the LOD, as quantitation requires a higher degree of accuracy and precision (See Figure 16).
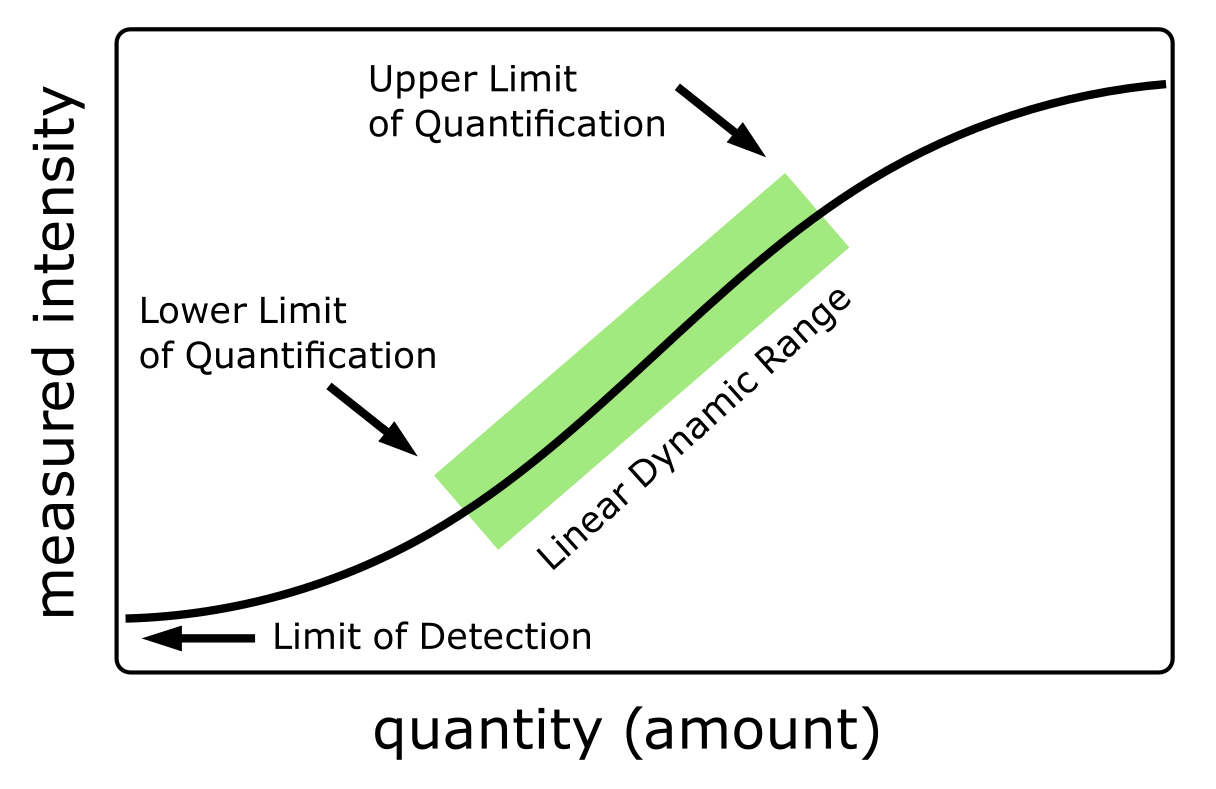
Several factors impact affect the LOD and LOQ in mass spectrometry, including the instrument’s sensitivity, MS method used, sample complexity and the stability of the analyte. The measures differ between instruments, ionization techniques and fragmentation methods.
It is important to note that the LOD and LOQ are not fixed values and can vary depending on the circumstances of each individual measurement. Factors influencing them must thus be carefully considered when designing a mass spectrometry experiment9.
9 Loading an excessive amount of sample into a mass spectrometer, for example, will result in signal saturation at the detector, implying loss of quantitative information.
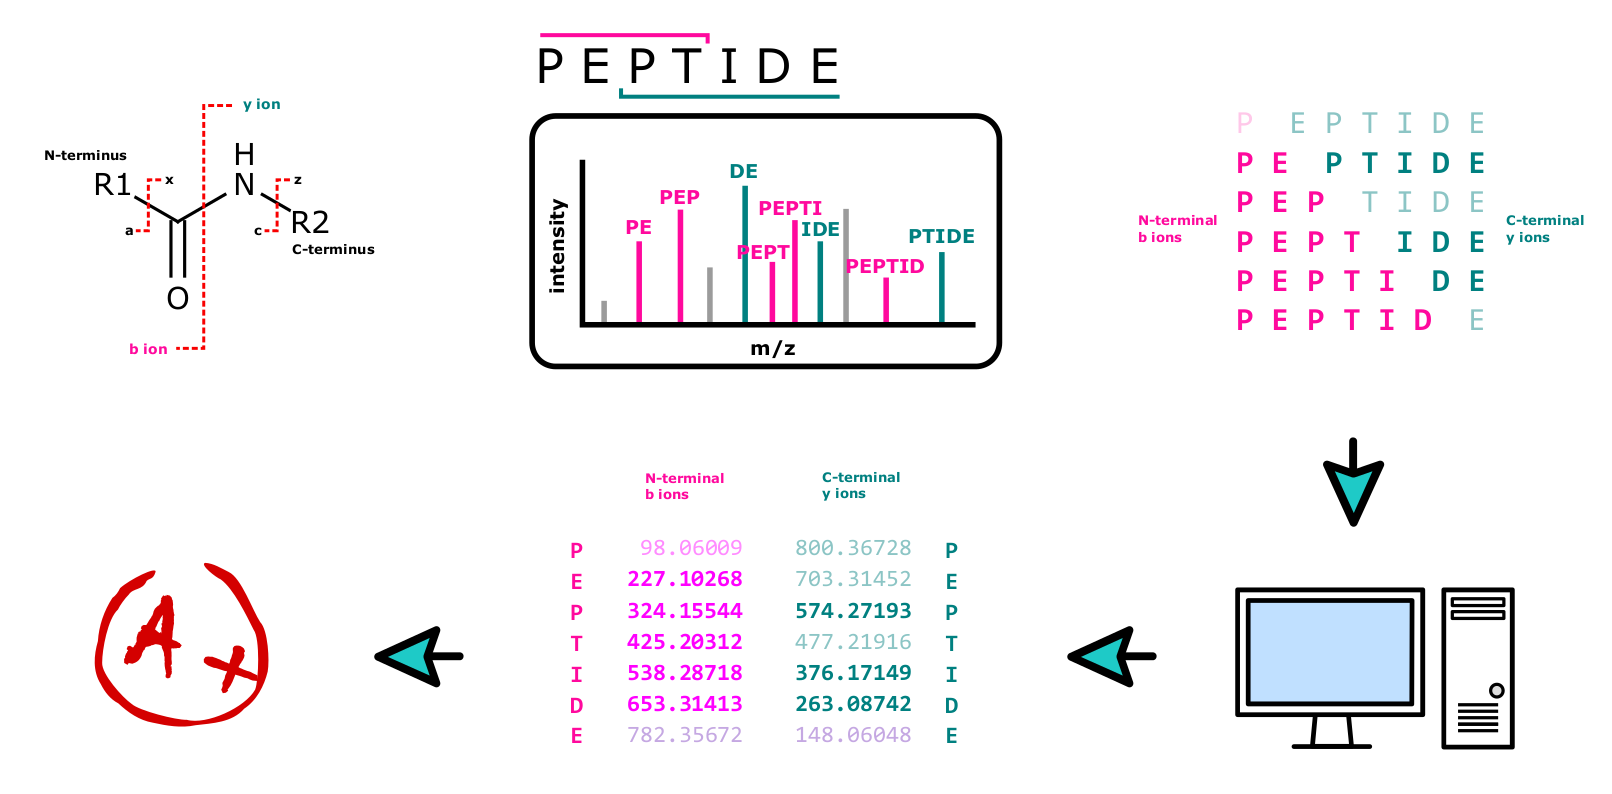
Spectrum Identification
In every single measurement, hundreds of thousands of spectra are acquired, an amount of data impossible to analyze manually. The process is instead performed by specialized software, which typically compares acquired mass spectra to a collection of theoretical spectra. Using a proteome database of the organism the analyte derives from, the algorithm performs in-silico digestion and fragmentation, generating hypothetical spectra potentially found in the sample. Truly measured mass spectra are compared to that collection and potential matches scored for their similarity. Examples for good (Figure 17) and bad (Figure 18) spectral matches are shown below.
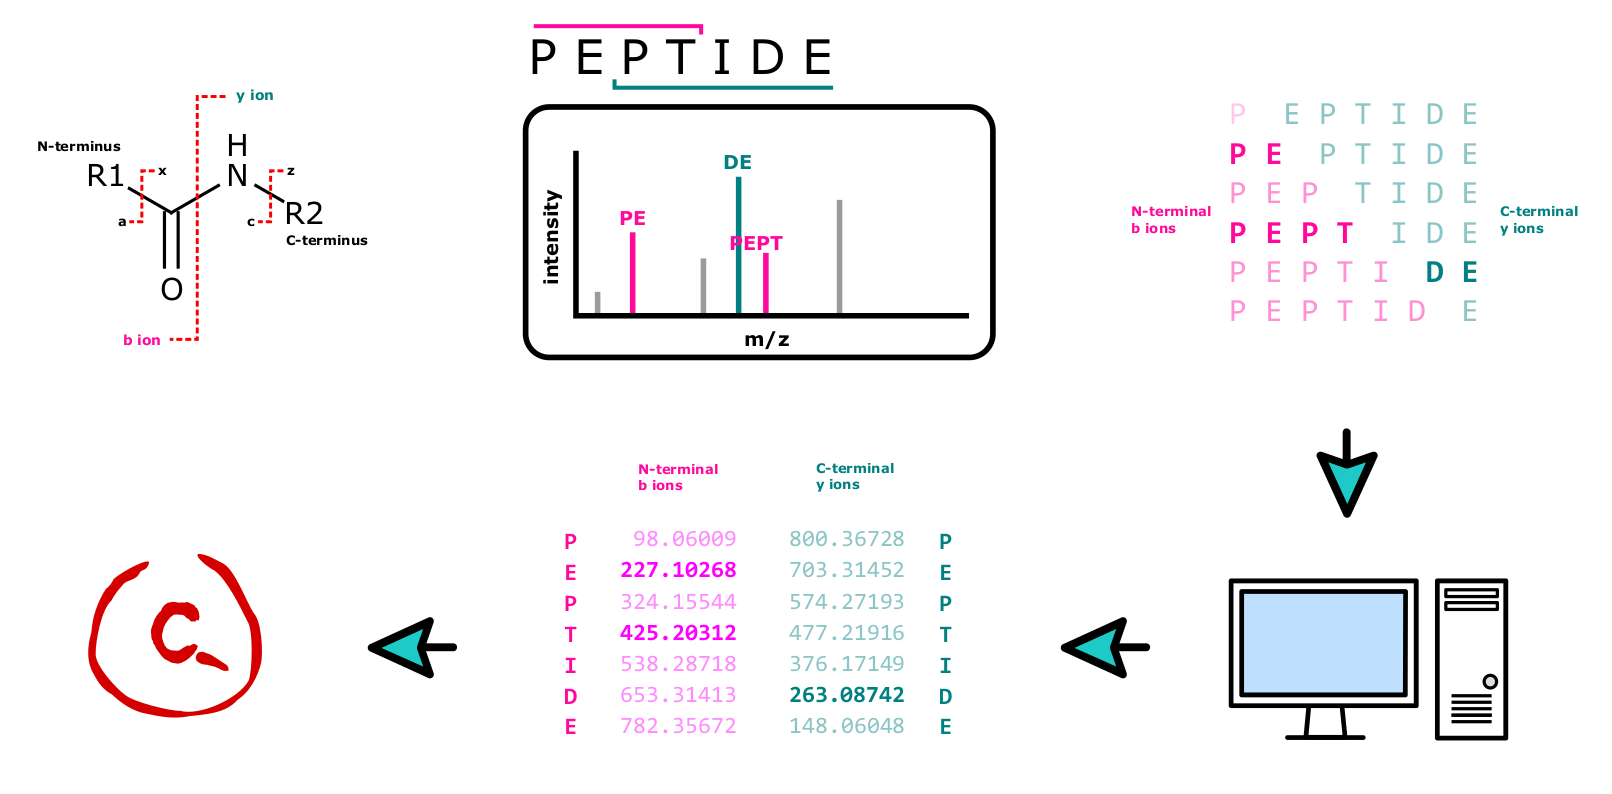
It is important to note that this spectra matching is influenced by a number of factors, including the quality of the mass spectra, the accuracy of the database being used10, as well as the algorithms being employed. Optimization of the software and settings used is thus just as important as the measurement itself.
10 The software will for example only match acquired spectra to the theoretical proteome fed to it. Using a wrong or incomplete database may thus imply incorrect peptide/spectrum matches.